Numbers we can show you. In public.
Worked examples, Melbourne benchmarks and teardowns of real figures. Every number names where it came from and when it was checked, and every piece ends on a move rather than a prediction.
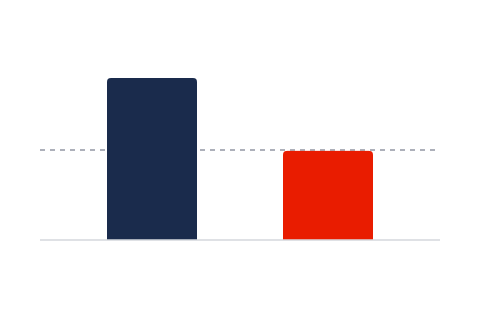
Group labour was 32.8%. One venue was losing money.
Common Hour is a sample group we built to demonstrate the report, so every dollar below is invented. The arithmetic is not. A group labour figure sitting comfortably inside its benchmark band said nothing was wrong, while one of the four venues ran at minus 4% contribution. Here is the split that found it, and how to run it on your own numbers.
Nine categories. Victoria is behind in every one.
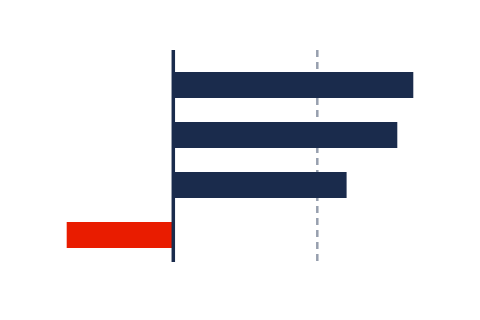
Split Victorian household spending into the nine categories the ABS publishes and every one of them grew slower than its national counterpart in the 12 months to June 2026. That has held at all 16 readings since March 2025, when the last category still ahead crossed over. Whatever you sell in Melbourne, the national growth rate is not your bar.
Victoria grew 4.0%. The country grew 5.1%.
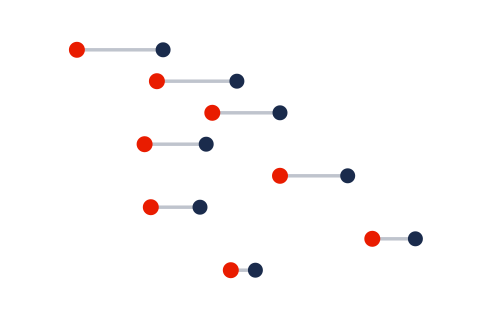
Same category, same ABS release, same twelve months: Victoria came in about 1.1 points under the national rate. That gap has held for 28 straight readings. Benchmark a Melbourne business against a national number and you are marking it against a market it does not sell into.
December runs 1.8x February. Adjusted, it's 1%.
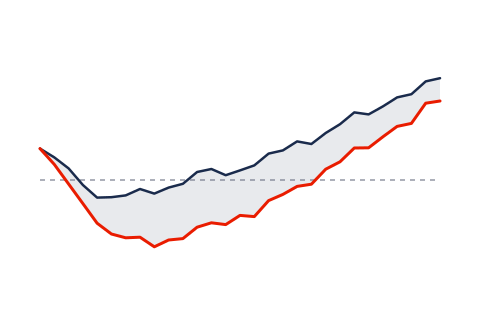
December ran 1.8 times February in Victorian clothing and footwear. Seasonally adjusted, those same two months sit within about 1% of each other. Before Q4 locks, compare December to last December, not to the month beside it.